Computer-aided Decision (CAD) System
## Pablo LasoI am a data scientist and machine learning engineer in Nashville, TN mostly using NLP and machine learning to solve business problems and deliver efficient, scalable solutions.Introduction
The radiology department at the hospital faces several tedious and time-consuming tasks that doctors or researchers need to perform after an MRI scan. For example, physicians who deal with patients with potential cases of Prostate Cancer (PCa) would benefit from a system that can help them in detecting possible cancerous areas in MR images and provide relevant statistical information. This system will streamline the diagnosis process and increase the efficiency of the radiology department.
CAD system
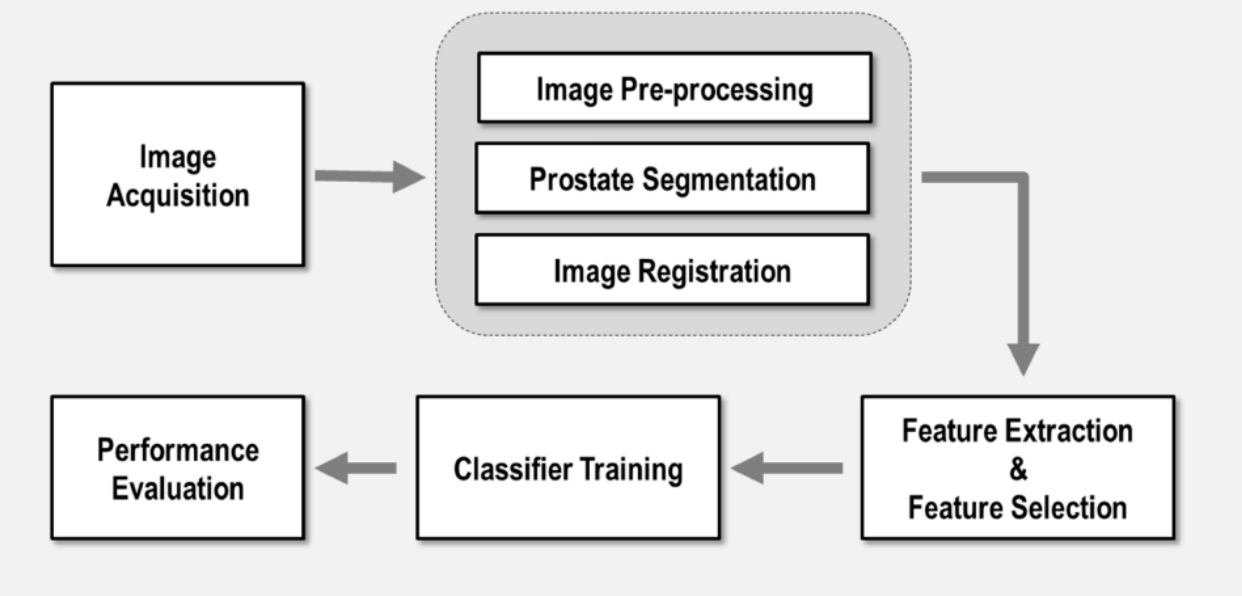
In this project a CAD system was developed for this aim. It was built for the radiology department at QuironSalud University Hospital (in collaboration with LAIMBIO) and part of a bigger project funded by General Electric healthcare. This CAD system is able to take Prostate MRI images as input, and generate a medical report including several statistical information, together with some images where possible findings representing potential cancerous areas are shown. Below a Typical workflow of a CAD system is shown. The most important steps are explained in the following sections of this page.
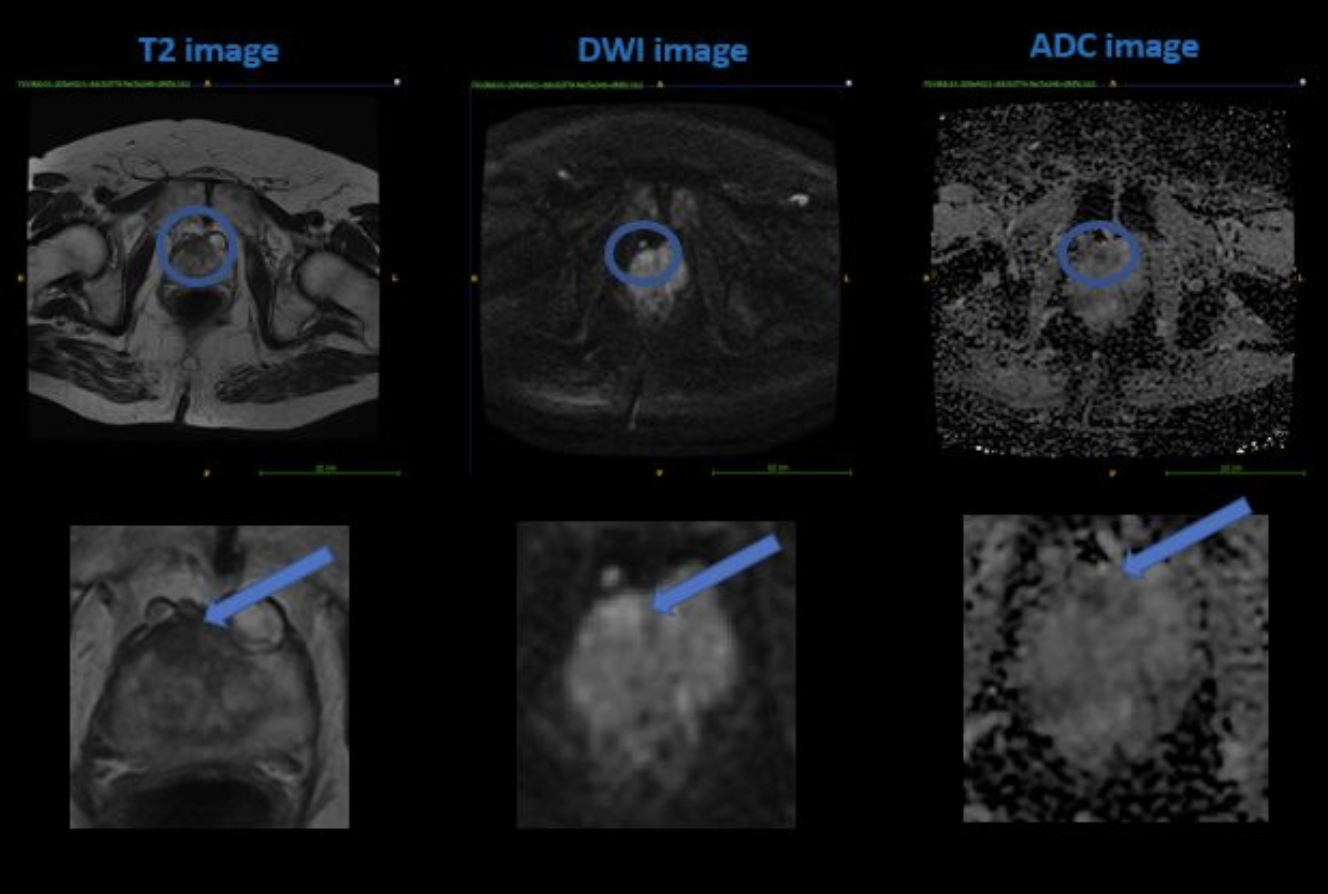
As observed from the image above, a PCa shows hypointense (dark) in both the T2wI and ADC map and hyperintense (bright) in the DWI. If these criteria are met, the algorithm assigns a higher PI-RADS score, indicating a higher severity. Conversely, if none or only certain criteria are met, the scoring will be lower and the confidence in the prediction will also be lower. This is one of the main features that our algorithm focuses on when evaluating the severity of PCa in a given mp-MRI sample, and it strives to learn how to use different feature values and combinations to determine the correct PI-RADS score.
Algorithm
The U-Net architecture was designed for the segmentation step in our DL-based algorithm. This architecture is used to divide the input images into two parts: the findings and the background. This process results in the identification of anatomical areas in the prostate with potential prostate cancer (PCa). After segmentation, a radiomics library is utilized to extract various features from the images. These features are then used to classify the images according to the PI-RADS range, with scores 1 and 2 being considered clinically insignificant and scores 3, 4, and 5 being considered significant findings. To evaluate the performance of the algorithm, different machine learning algorithms were tested, including Support Vector Machines (SVM) and Random Forest.
Segmentation with Deep Learning
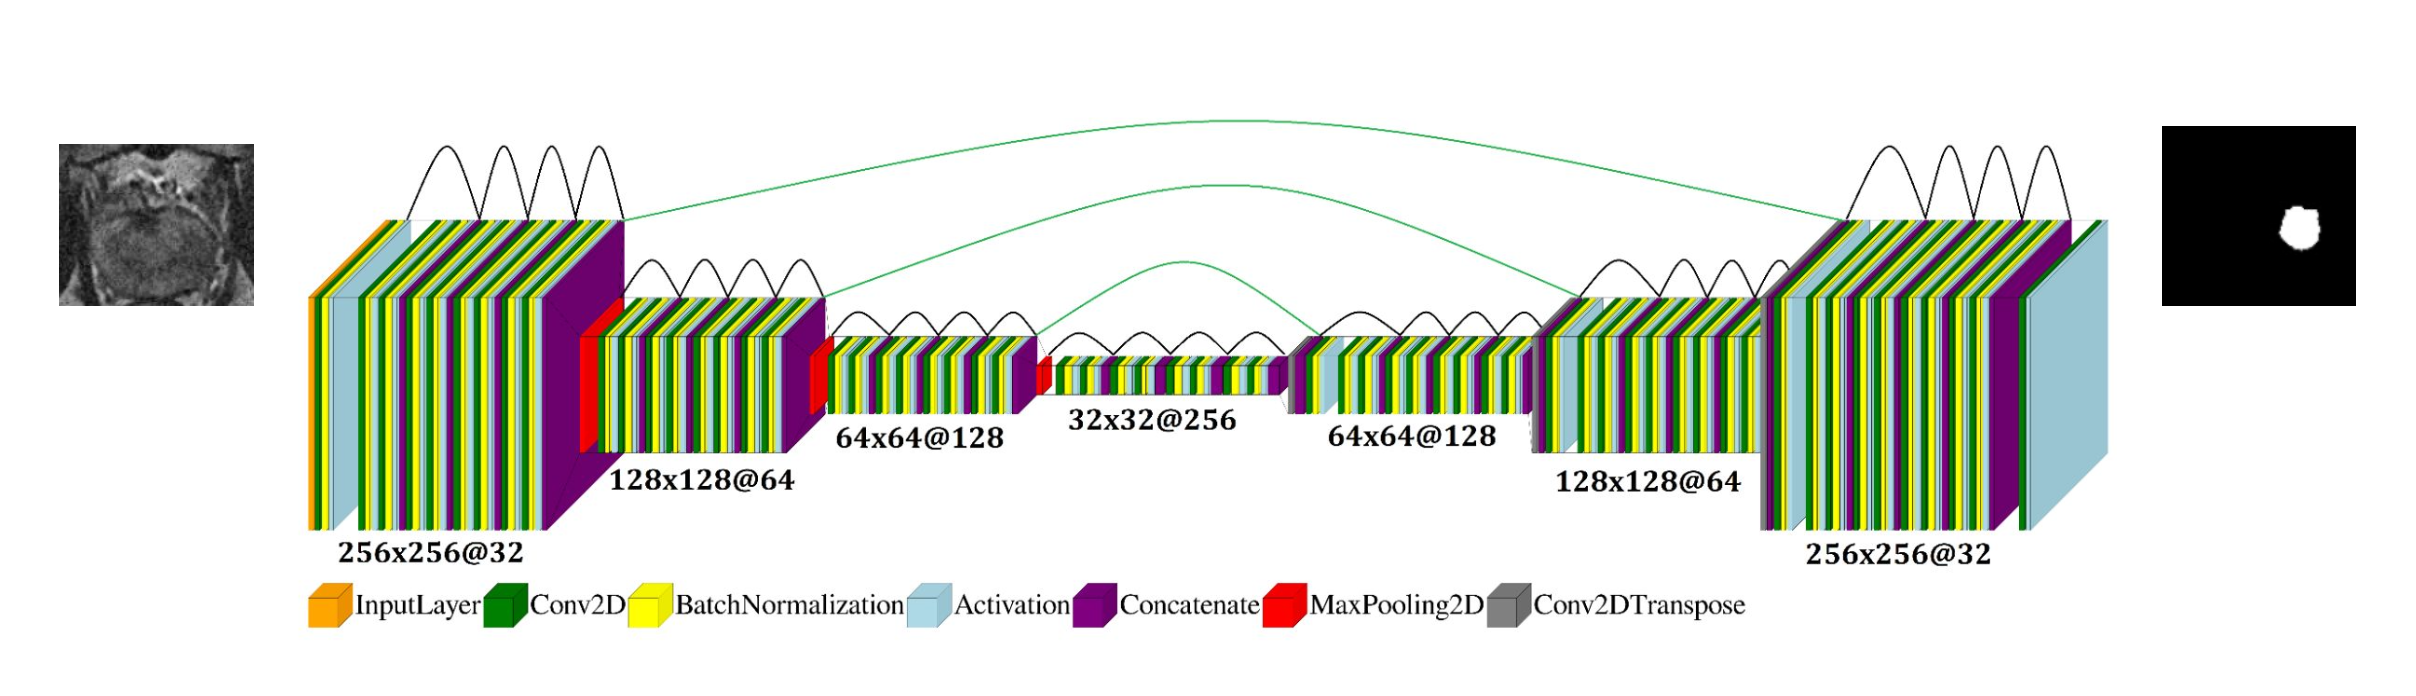
The U-net architecture is designed for segmentation in our DL-based algorithm for the PCa detection system. It is named after its appearance, which resembles the letter 'U'. The input images are processed by the feature maps, and the matrix size representing the image reduces through maxpooling, where the highest value is taken from each image path. This process is repeated several times, and the image is then reconstructed back to its original size through a reverse process. The result is a binary mask, where the 1s represent the ROI (Region of Interest) of a potential PCa and 0s represent the rest of the image or background. If the input image is multiplied by the mask, the result will only show the ROI of the image. This result is later used by the Radiomics feature extractor.
Classification with Machine Learning (ML) and Radiomics
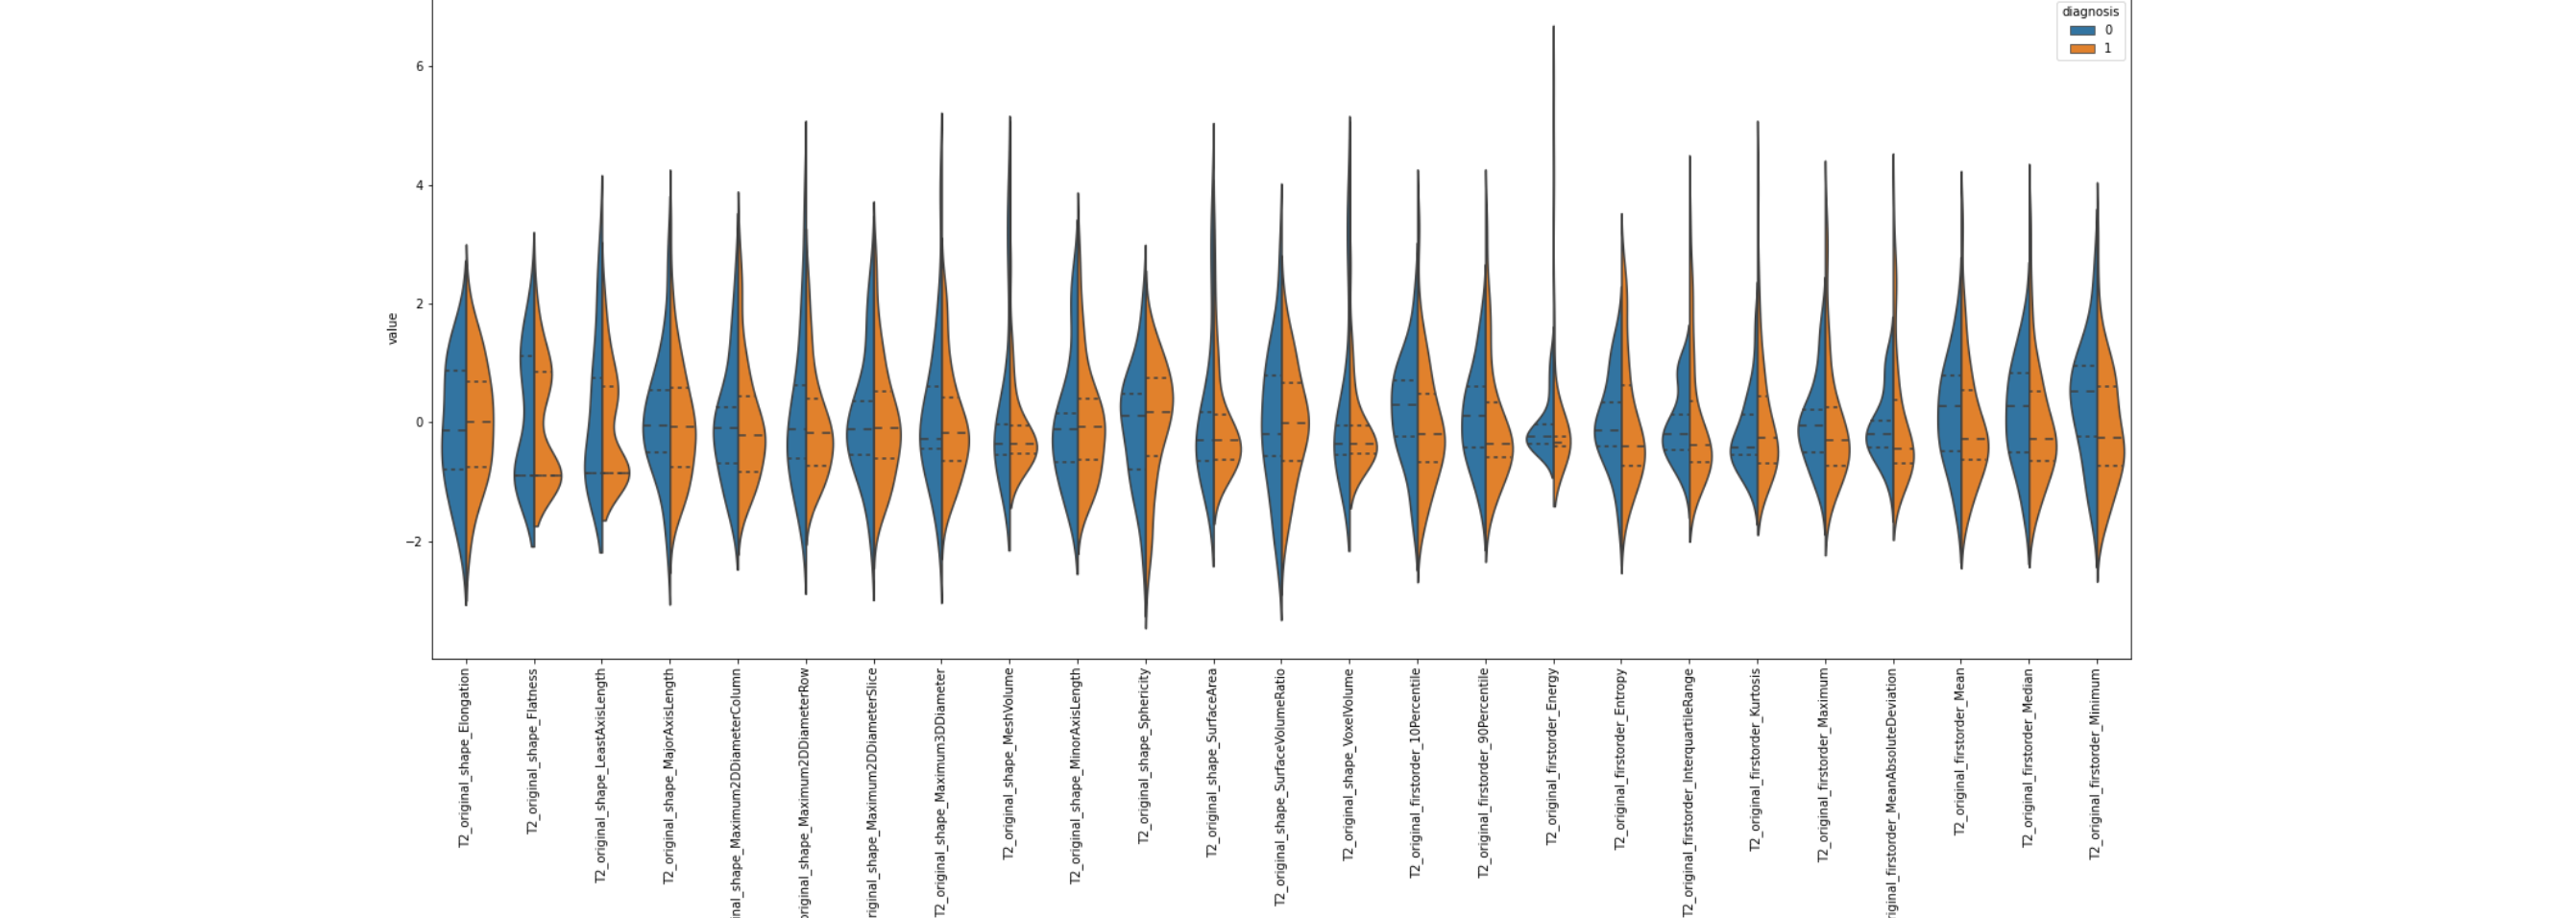
In order for our system classify the image in to a PI-RADS score, we fed our ML classifiers with the features from the ROI of the image. This features are extarcted by means of a python package called pyradiomics, which takes both the MR image and the ROI. The output are several image features such as pixel value (to recognize hyperintense and hypointense regions), sphericity, or volume. Note that the ROI is the same for all three image modalities, so the feature extraction process is repeated three time per subject. The image below (left) shows some of the features extracted, and their distributions grouped by the diagnosis result, i.e., blue for Clinically Insignificant (CI) and orange for Clinically Significant (CS).
However, there are several problems that we have to overcome between feature extraction using pyRadiomics and constructing the model (building a machine learning classifier). Firstly, as shown in the figure above (right), there are too many features and they are strongly correlated. This is not only inefficient because many features do not provide additional information, but it can also pose a major problem known as the "curse of dimensionality". To address this issue, we perform feature selection to remove highly correlated features, but even with this step, the number of features can still be high. We use different techniques for feature selection, including statistical methods (e.g. Chi-squared, ANOVA, Pearson's coefficient, or Mutual Information), other machine learning models, or embedded models. After that, we use Dimensionality Reduction techniques (such as PCA) to further reduce the number of features by mapping them into a new feature space that ideally preserves important information but removes noisy (irrelevant) features. The figure below (left) shows an example of feature importance, from which the top features are selected as part of the Feature Selection process. The other figure below (right) represents the features already ranked by importance. Different feature selection methods have been used for demonstration purposes.
The image above on the left shows the bar graph of the feature importance as determined by a Random Forest algorithm. The most relevant feature according to this algorithm was the "GrayScale Emphasis" in ADC maps. This is because dark areas in ADC maps are often associated with cancerous areas. However, relying on this feature alone is not enough to achieve a high accuracy. Combining ADC map features with those from other MR image modalities is necessary for the ML model to produce accurate results. The threshold for feature selection (see red line) is defined as a function of the mean value multiplied by a factor k. Another alternative is to select the top N features.
The results of the ML-based algorithm for multi-parametric magnetic resonance imaging (mp-MRI) in binary classification (Clinically Significant (CS) vs Clinically Insignificant (CI)) range from 0.89 to 0.95 in accuracy. However, the performance drops when it comes to classifying the image into different PI-RADS classes (1 to 5), which can be beneficial for physicians. The classifiers struggle to differentiate between classes 3 and 4, which is also a challenge in the official PI-RADS guidelines. The confusion matrix shows that the predicted labels are sometimes misassigned to the correct class, highlighting the difficulty of the complete classification problem. Class imbalance was addressed for the training set, but the test image set, used to generate the confusion matrix, is descriptive of the original data, which was significantly imbalanced. The test set must always be independent in every step of the ML-model building process, including feature-related steps.
Report
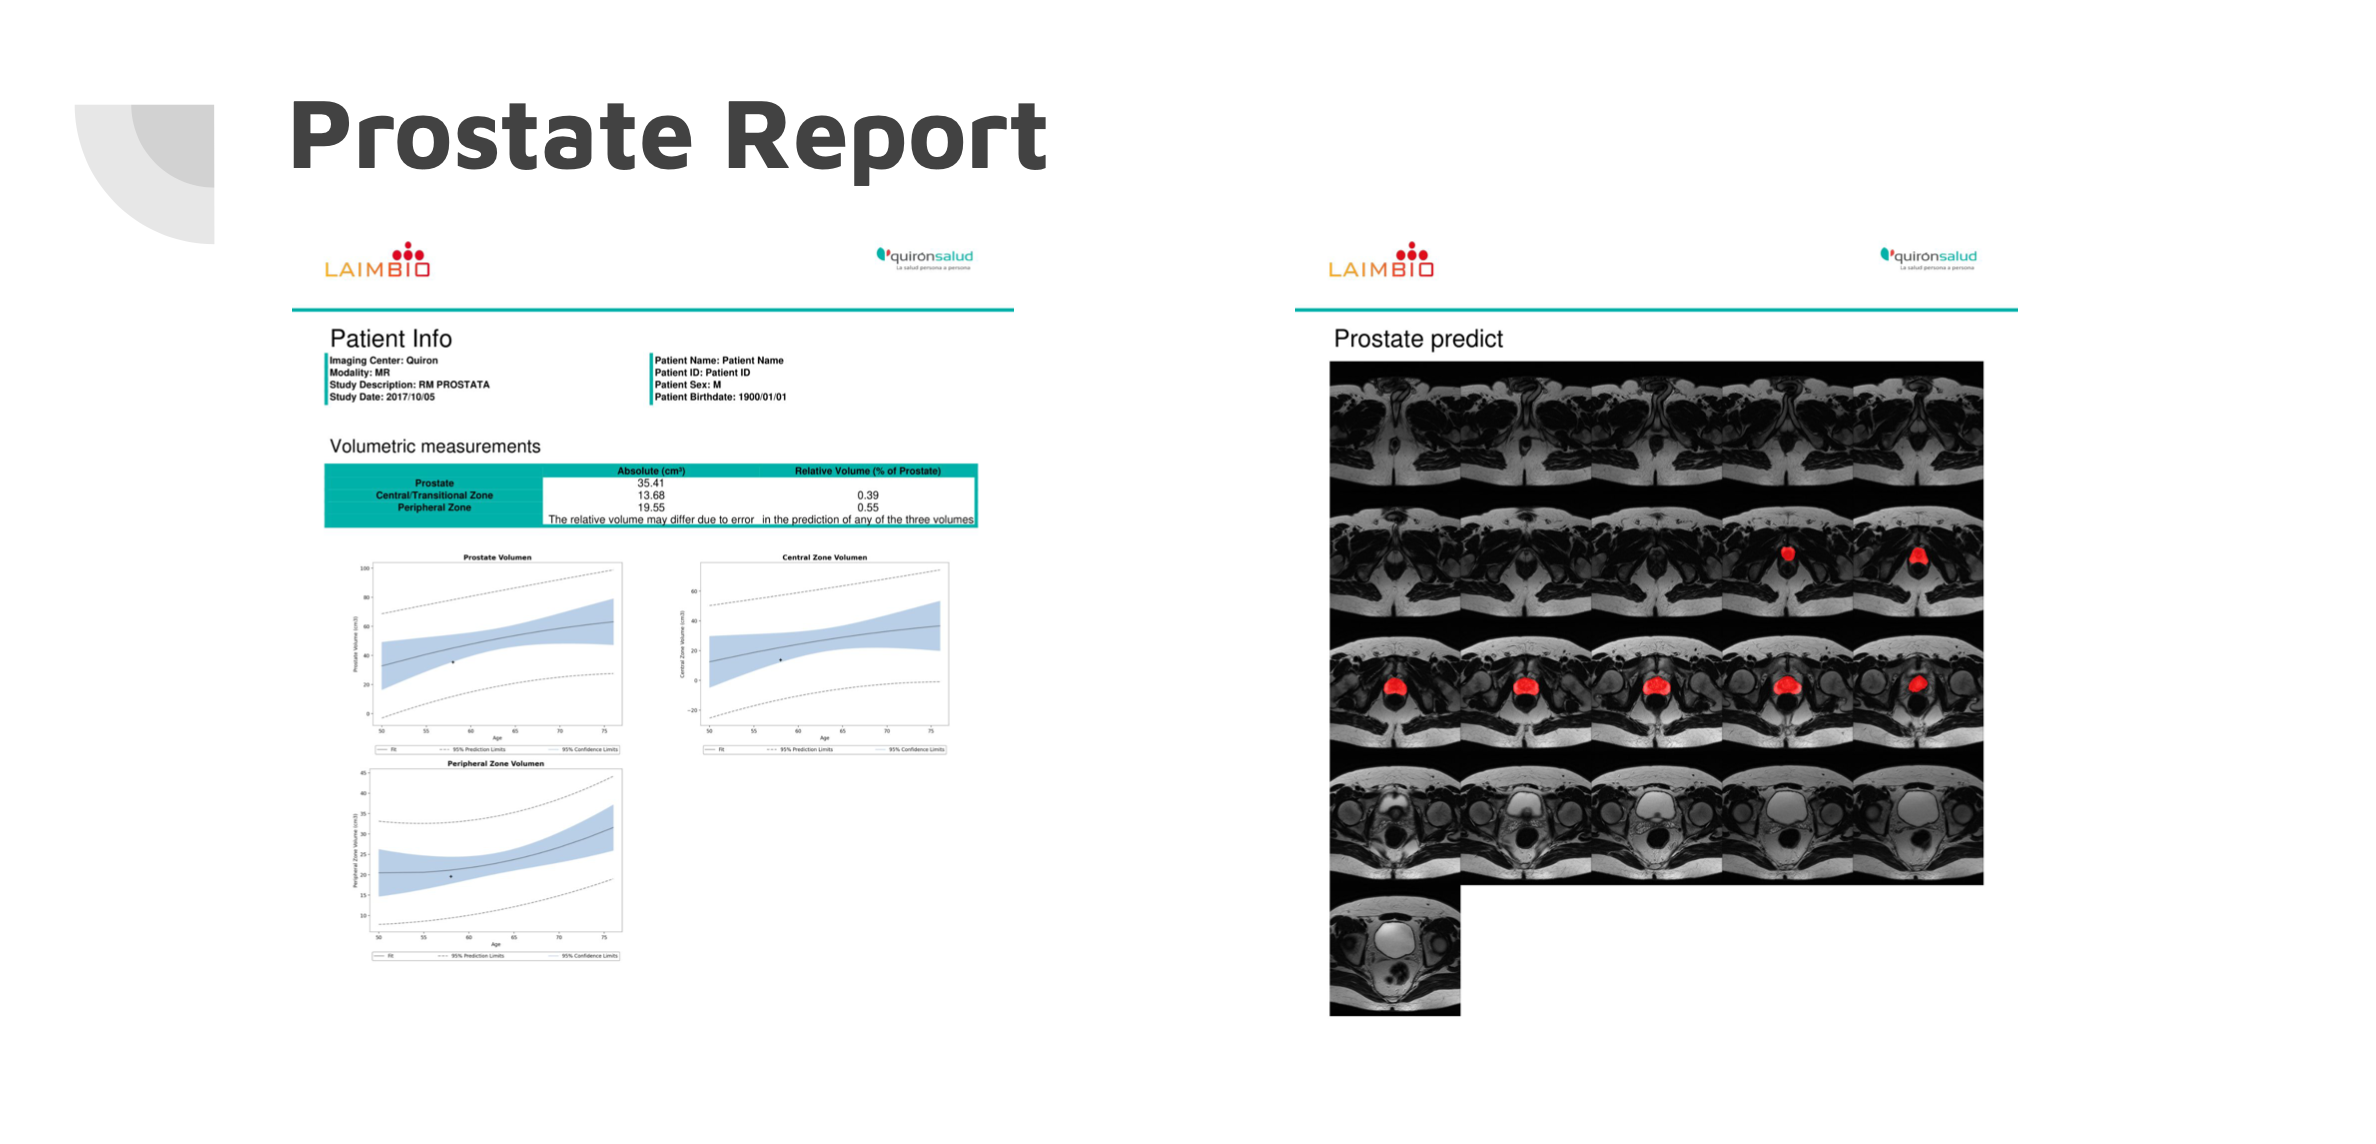
The Prostate Cancer Report included the following information:
- Basic statistical data such as prostate volume.
- Potential PCa (prostate cancer) findings in the prostate MR images.
- A suggested PI-RADS score, which was the result of the analysis of the prostate MR images using the U-Net deep learning architecture, combined with radiomics features, and a machine learning classifier.
The report was in the form of a simple PDF file that presented the findings of the algorithm in an easy-to-understand format for the physician to review.
Conclusion
In conclusion, we have described the main steps towards building a ML model that classifies prostate mp-MR images according to the PI-RADS scoring. These steps include Semgemtation (U-net), feature extraction and selection, classification, and model performance. Many topics have been overlooked in this page, such as image acquisition, class imbalance, image pre-processing, registration, data set creation (masks to train the DL model), most data analysis and processing, and other classifiers and classification problems.
In the end, for a complete PI-RADS classification problem (5 classes), the best result was obtained by a Ridge classifier, after a Mutual Information-based feature selection.